DuPont ROE Analysis: Breaking Down What Drives Profitability
Break down Return on Equity into Profit Margin, Asset Turnover, and Leverage — and see what truly drives a company’s profitability.
When investors see a company with a high Return on Equity (ROE), the natural reaction is:
“This company must be great!”
But the truth is — not all high ROE numbers are equal.
Some businesses generate strong ROE because they’re genuinely efficient. Others achieve it by taking on more debt or boosting margins temporarily.
At FindGreatStocks.com, we use the DuPont ROE Decomposition to reveal what truly drives a company’s profitability — and to identify those that create sustainable value over time.
What Is Return on Equity (ROE)?
ROE measures how effectively a company generates profit from shareholders’ equity.
In its simplest form:
ROE = Net Income ÷ Shareholders’ Equity
It tells you how much profit the company earns for each dollar invested by shareholders.
But by itself, ROE doesn’t explain where those returns come from.
That’s where the DuPont analysis comes in.
The DuPont Formula — Three Drivers of ROE
The DuPont model breaks down ROE into three components that explain how profits are created:
ROE = Profit Margin × Asset Turnover × Financial Leverage
Or, in plain words:
Profit Margin – how much profit the company keeps from each dollar of sales.
Asset Turnover – how efficiently it uses assets to generate revenue.
Financial Leverage – how much leverage (debt) amplifies returns on equity.
Each part tells a different story about the business.
Understanding Each Component
Profit Margin
Net Income ÷ Revenue
Shows operational efficiency — how much profit remains after all expenses.
High margins indicate pricing power, cost control, or a strong competitive advantage.
Asset Turnover
Revenue ÷ Total Assets
Measures how well the company uses its assets to generate sales.
Retailers often have low margins but high turnover; luxury brands often the opposite.
Financial Leverage
Total Assets ÷ Shareholders’ Equity
This reflects how much debt the company uses.
Leverage can magnify returns when times are good — but it also increases risk if earnings fall.
Example — Same ROE, Different Stories
| Company | Profit Margin | Asset Turnover | Financial Leverage | ROE | Interpretation |
| A | 20% | 0.5 | 2.0 | 20% | High margin, moderate leverage — efficient and stable |
| B | 10% | 1.0 | 2.0 | 20% | Lower margin but strong efficiency — balanced business |
| C | 10% | 0.5 | 4.0 | 20% | High leverage — ROE inflated by debt, higher risk |
All three achieve a 20% ROE, but only the first two do it through sustainable business performance.
Company C’s high leverage means its ROE could collapse in a downturn — a key insight the DuPont model reveals instantly.
How We Use DuPont ROE at FindGreatStocks.com
In our scanner, we break down ROE into its three building blocks for every company:
Profit Margin (Net Income / Revenue)
Asset Turnover (Revenue / Total Assets)
Financial Leverage (Assets / Equity)
This helps investors quickly identify how a company earns its returns:
Through operational excellence (high margins),
Through efficiency (strong asset use), or
Through leverage (financial risk).
By visualizing these components, we make it easier to see whether profitability is quality-driven or risk-driven.
How to Use It in the FindGreatStocks Scanner
Open the Scanner at FindGreatStocks.com
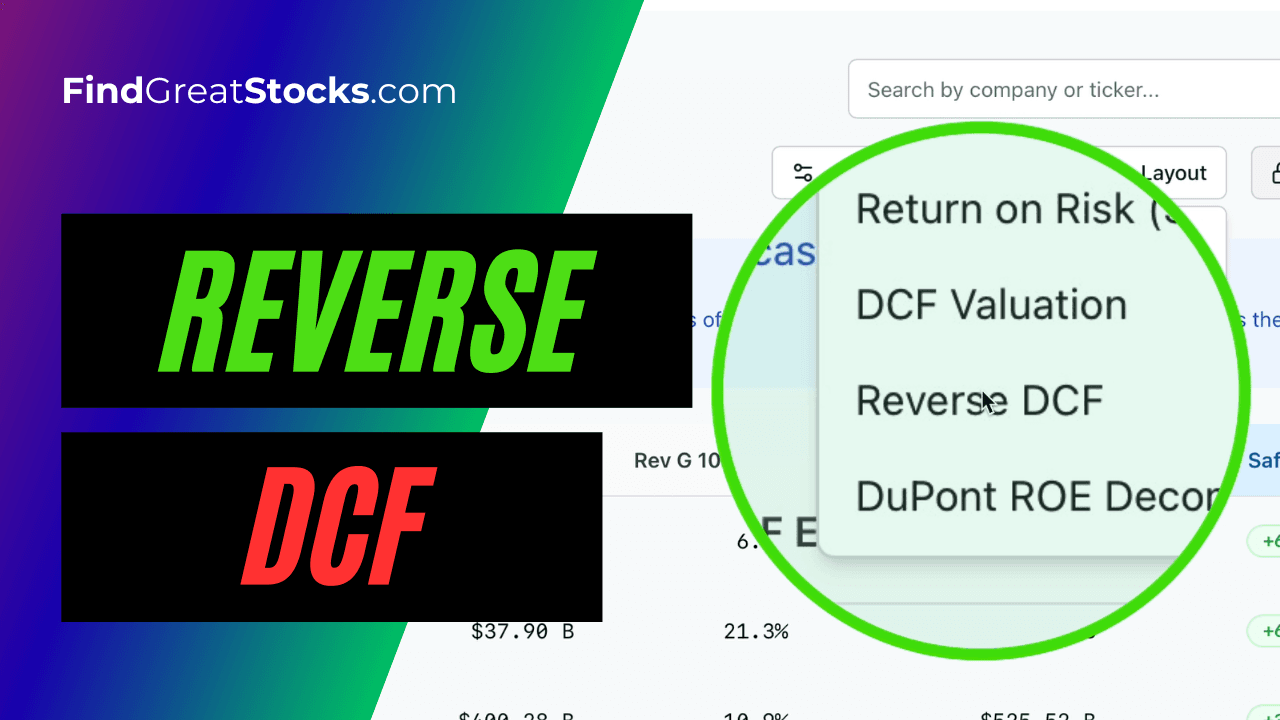
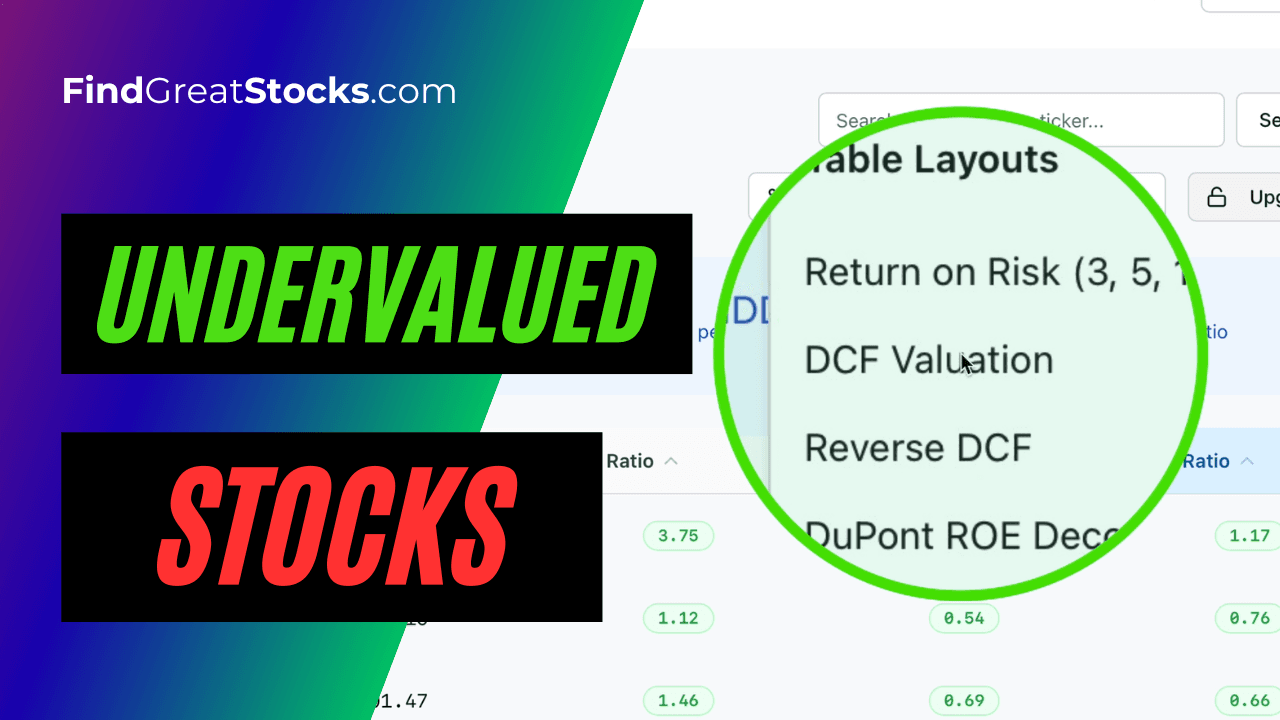
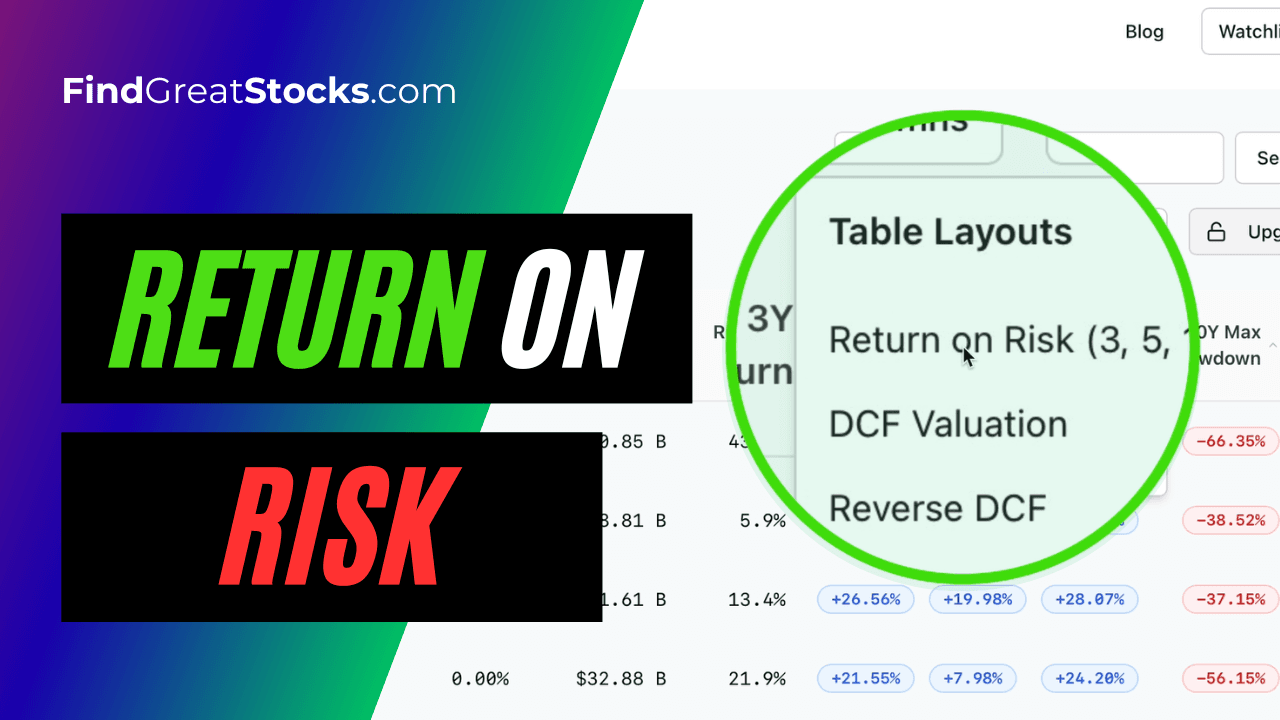
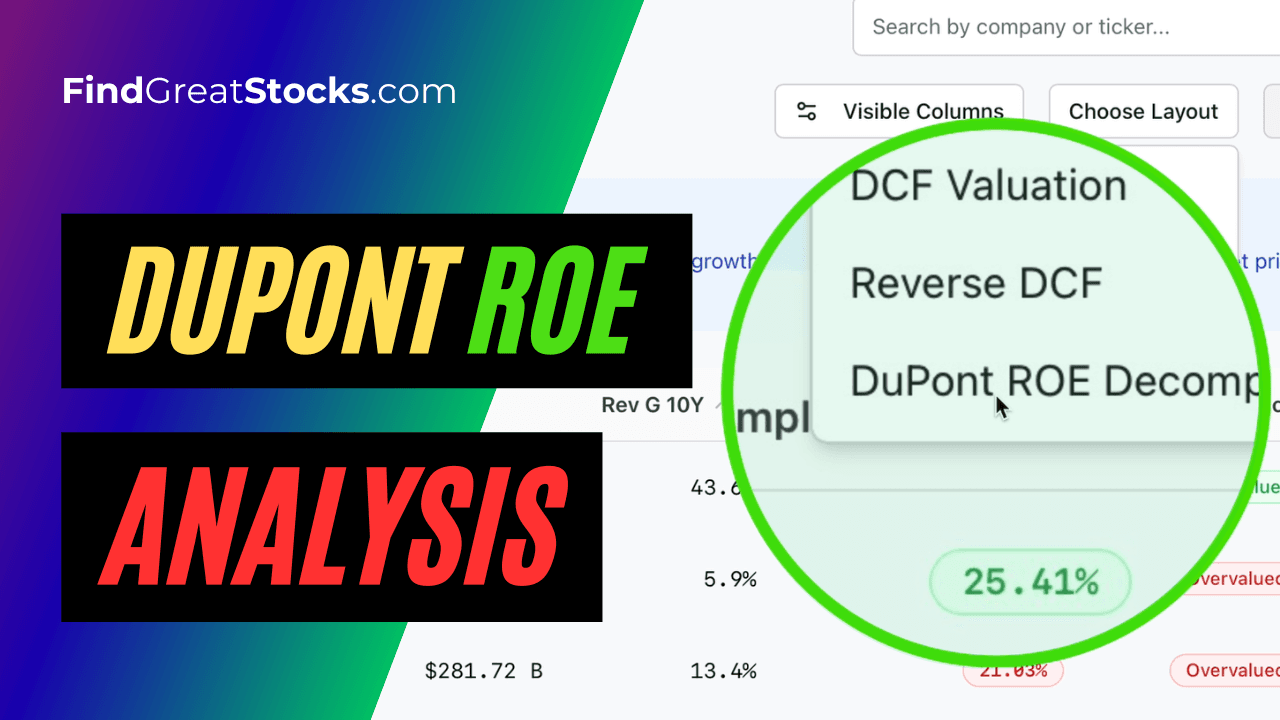
Click the “Choose Layout” section
Select “DuPont ROE Decomposition”
Rank or filter companies to see which achieve high ROE through genuine strength — not excessive leverage.
Why It Matters
ROE alone can be misleading.
A company can have excellent ROE for three very different reasons:
High profitability from strong operations.
Smart asset utilization.
Heavy use of debt.
DuPont analysis separates these effects, helping you spot:
Quality compounders that grow efficiently, and
Risky companies whose returns rely on leverage.
This insight is crucial for long-term investors who care about sustainable returns.
Conclusion
DuPont ROE decomposition transforms a single headline number into a deeper financial story.
It shows whether profitability stems from business strength, efficiency, or financial risk — letting you invest with clarity, not assumptions.
At FindGreatStocks.com, every investor can analyze this breakdown instantly and make more informed decisions about business quality.
👉 Visit FindGreatStocks.com to explore ROE components and discover which companies generate returns the right way.