Return on Risk: How We Measure It at FindGreatStocks.com
Discover how to compare stocks by risk-adjusted performance. We calculate Return on Risk as Annual Return ÷ Max Drawdown across 3, 5, and 10 years — a
At FindGreatStocks.com, we believe that high return without risk context means nothing.
A truly great company isn’t the one with the biggest gains — it’s the one that delivers the best return per unit of risk.
That’s why we developed the Return on Risk (AR/MDD) metric — a simple, intuitive way to compare how efficiently different companies turn risk into long-term reward.
What Is “Return on Risk”?
Return on Risk measures how much annual return a company delivers relative to the maximum drawdown it has experienced.
Return on Risk = Annual Return ÷ Maximum Drawdown
It shows how efficiently a company rewards investors for every percentage point of potential loss during bad periods.
A higher Return on Risk means the company has produced strong, consistent gains while avoiding deep declines.
A lower score indicates volatile or fragile performance — returns that came with big downside exposure.
How We Measure It at FindGreatStocks.com
At FindGreatStocks, we calculate Return on Risk using real market performance over multiple horizons:
| Period | Formula |
| 3-Year Return on Risk | 3-Year Annualized Return ÷ 3-Year Max Drawdown |
| 5-Year Return on Risk | 5-Year Annualized Return ÷ 5-Year Max Drawdown |
| 10-Year Return on Risk | 10-Year Annualized Return ÷ 10-Year Max Drawdown |
Why It Matters
Many investors only look at returns.
But two stocks with the same 10% annual return can have very different risk profiles.
Company A: 10% annual return, max drawdown 15% → RoR = 0.67
Company B: 10% annual return, max drawdown 50% → RoR = 0.20
Which would you rather own?
Return on Risk quantifies this difference so you can spot companies that compound steadily, not just occasionally.
How to Use It Inside the FindGreatStocks Scanner
We’ve made it simple to explore this metric directly inside our platform:
Open the Scanner at FindGreatStocks.com
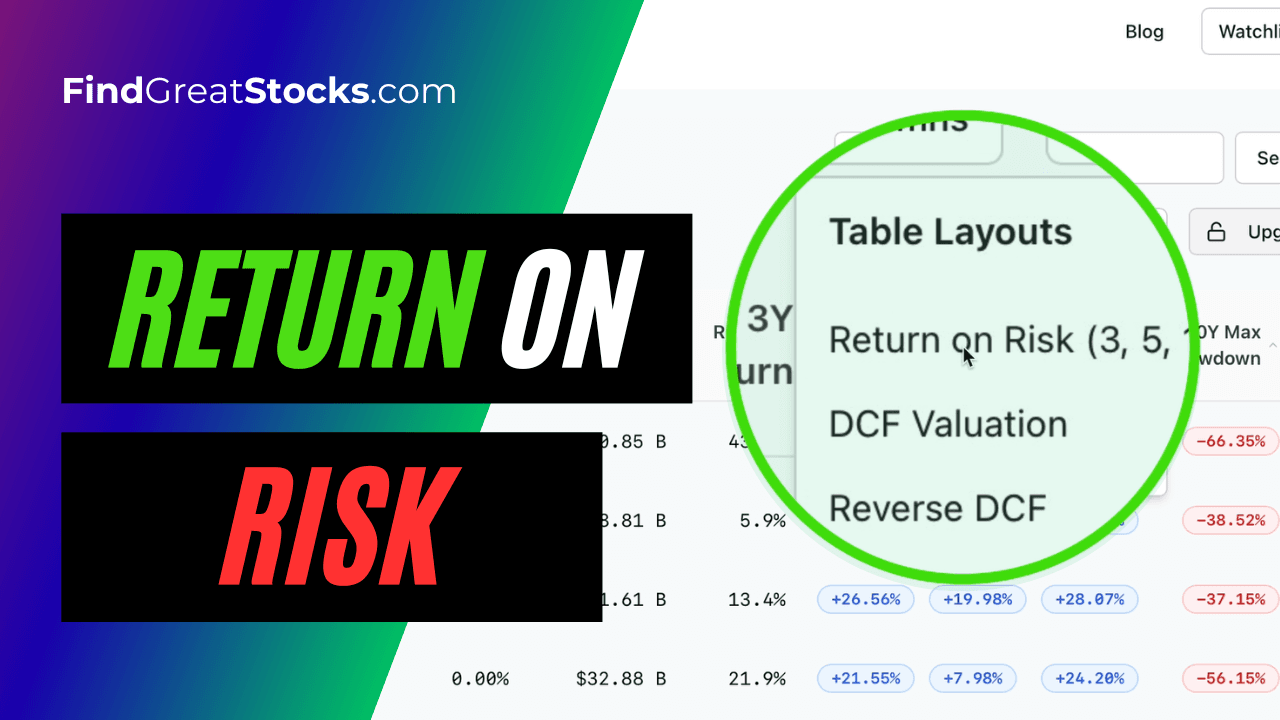
Click the “Choose Layout” section
Select “Return on Risk (3, 5, 10 Years)”
Rank the stocks by this ratio — highest to lowest
Instantly see which companies deliver the best risk-adjusted performance
Conclusion
Return on Risk helps investors focus on what truly matters — how efficiently a company turns risk into reward.
By comparing Annual Return to Max Drawdown across 3, 5, and 10 years, you can spot the businesses that compound steadily through cycles, not just in bull markets.
At FindGreatStocks.com, we make it simple to analyze, compare, and rank companies by this metric — all inside the scanner.
👉 Visit FindGreatStocks.com and find your next great investment today.