How to Use Reverse DCF to Spot Undervalued Stocks Fast
Find out if a stock’s price reflects realistic expectations. We calculate the market-implied growth rate and compare it to historical 10-year growth.
Investors often ask: “Is this stock cheap or expensive?”
But there’s a more insightful question:
“What level of growth is already priced into this stock?”
That’s what a Reverse Discounted Cash Flow (Reverse DCF) analysis reveals.
Instead of forecasting growth yourself, it works backward to calculate the growth rate the market assumes — the one that makes the current price appear “fair.”
At FindGreatStocks.com, we automatically compute this implied growth rate for every company and then compare it to its historical 10-year revenue growth to help investors instantly see if the market is too pessimistic or too optimistic.
What Is Reverse DCF?
A standard DCF model estimates intrinsic value from assumed growth.
A Reverse DCF inverts that logic:
It starts with the current market price and solves for the growth rate (g) that makes the DCF valuation equal to the company’s Market Cap.
If that implied growth is lower than the company’s long-term growth history, it may be undervalued — meaning the market expects the business to slow more than its fundamentals suggest.
If it’s higher, it may be overvalued, as the market is pricing in unrealistically strong future performance.
How We Calculate Reverse DCF at FindGreatStocks.com
Inputs
We use two key data points:
Market Cap (current)
Free Cash Flow (FCF, trailing twelve months)
And three fixed constants (assumptions):
Discount rate (r): 10%
Terminal growth (gₜ): 2.5%
Projection horizon: 10 years
Target
We work backward to find the annual growth rate of Free Cash Flow that makes the company’s estimated value (from our DCF model) match its current market capitalization.
In other words, we calculate the growth rate the market is implicitly assuming based on today’s stock price — the level of future performance already “priced in.”
DCF Engine
We use the same DCF mechanics as our intrinsic valuation model.
Here, we assume a single constant growth rate (g) — meaning the company’s Free Cash Flow is projected to grow by the same percentage each year for the next 10 years.
In other words, if the implied growth rate turns out to be 8%, our model assumes FCF increases by 8% every year over that 10-year period.
We then:
Forecast those annual FCF values using this steady growth.
Discount each year’s cash flow back to today at a 10% rate.
Estimate a terminal value beyond year 10 using a 2.5% long-term growth.
Add all discounted cash flows and the terminal value to get the total DCF Enterprise Value.
This allows us to see what constant growth rate would make the company’s value equal its current market capitalization — revealing the market’s implied growth assumption.
Solver
We apply a binary search algorithm to find that precise growth rate:
If calculated EV < Market Cap → increase g
If EV > Market Cap → decrease g
After ~100 iterations, we converge on the DCF Implied Growth Rate — the annual growth the market is pricing in.
Binary Search is an algorithm that quickly finds a target value by repeatedly dividing a range of possible answers in half. In our Reverse DCF model, it’s used to efficiently find the growth rate that makes the DCF valuation equal to the company’s market capitalization.
Comparing Implied Growth to Historical Growth
Once we find the implied growth rate, we compare it to the company’s 10-year historical revenue growth, which we treat as a proxy for the business’s long-term growth potential — assuming profit margins stay roughly the same as they are today.
If Implied Growth < 10Y Revenue Growth, the market expects slower-than-historical performance → the company may be undervalued (shown in green).
If Implied Growth > 10Y Revenue Growth, the market expects faster-than-historical growth → the company may be overvalued (shown in red).
This simple color-coded view lets you see, at a glance, whether a stock’s price implies realistic, pessimistic, or overly optimistic expectations.
How to Use It Inside the FindGreatStocks Scanner
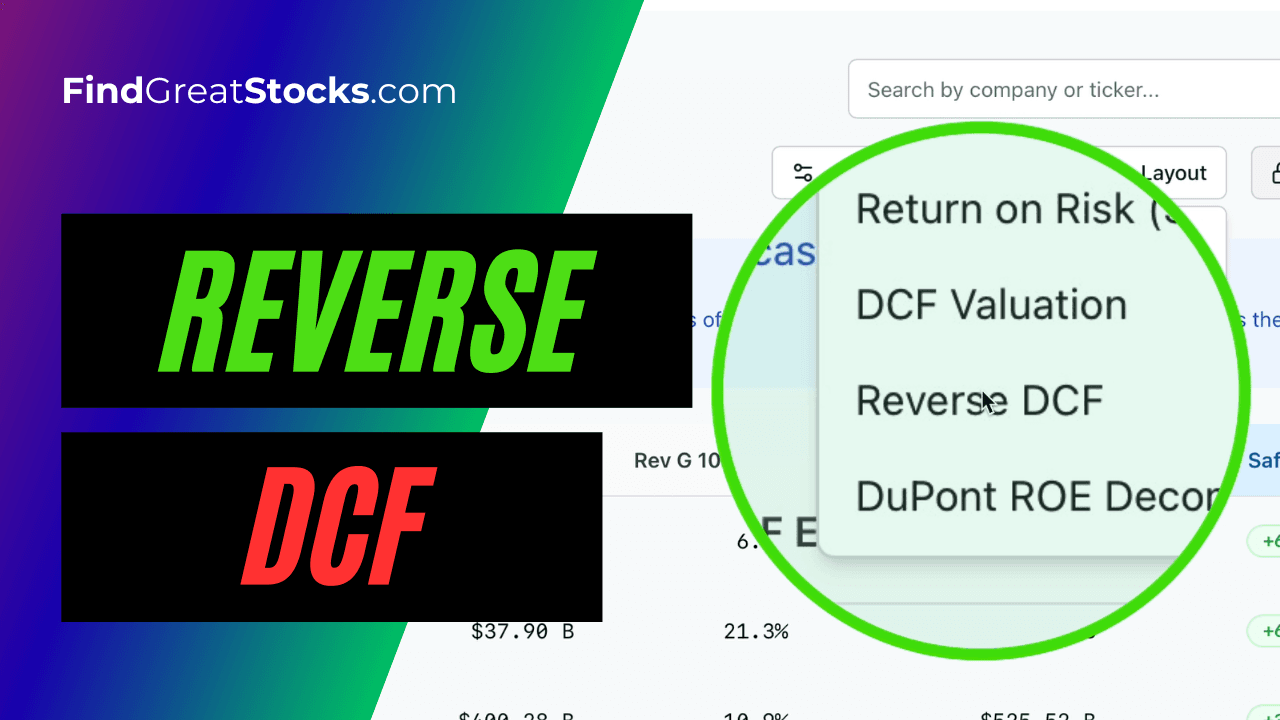
Open the Scanner at FindGreatStocks.com
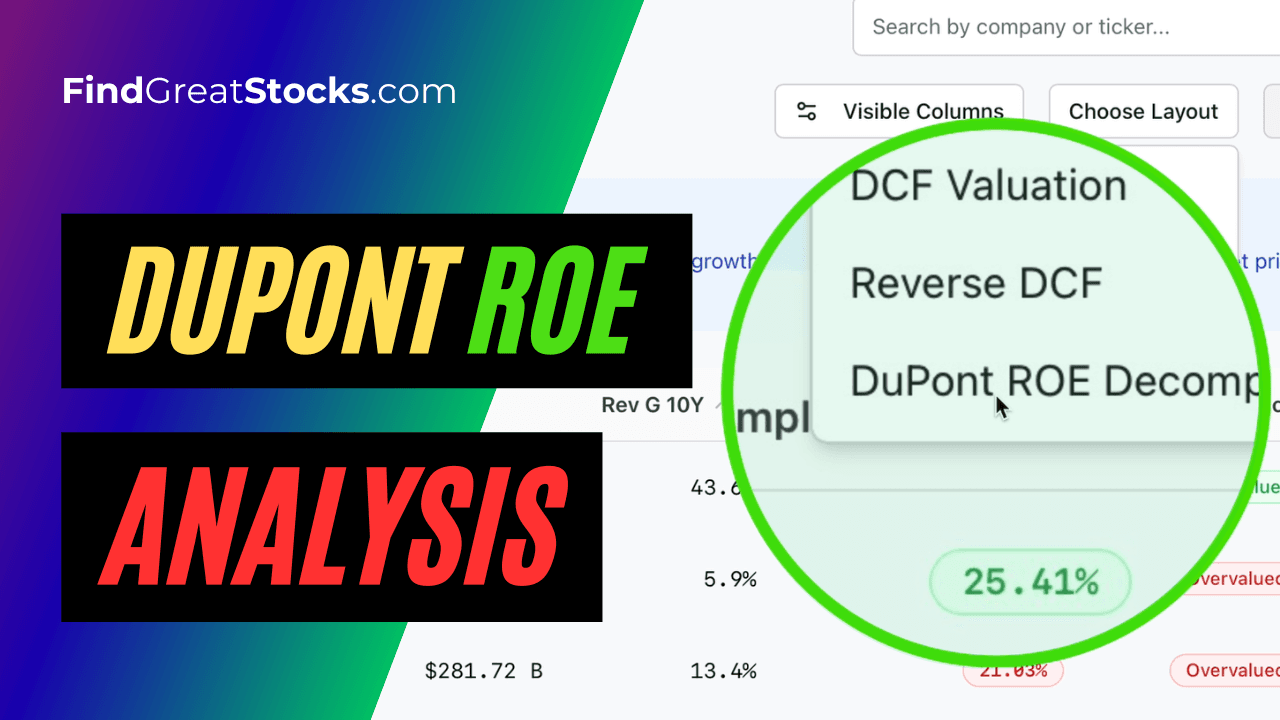
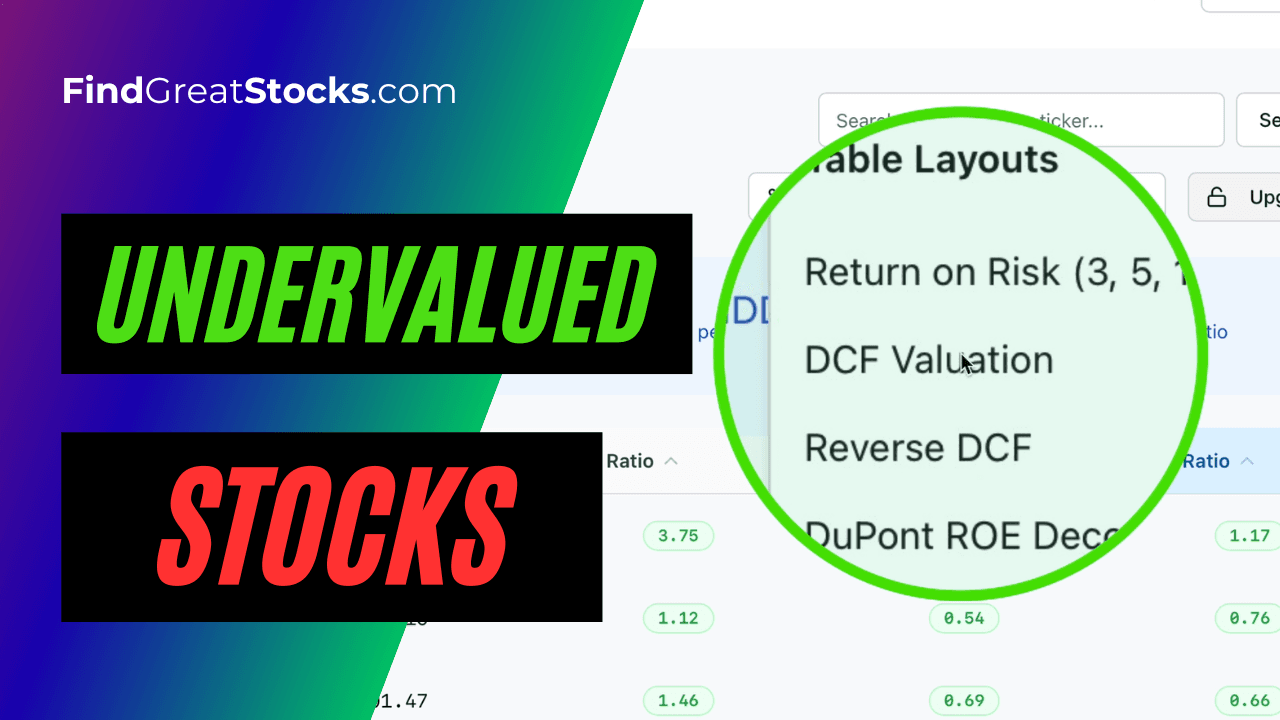
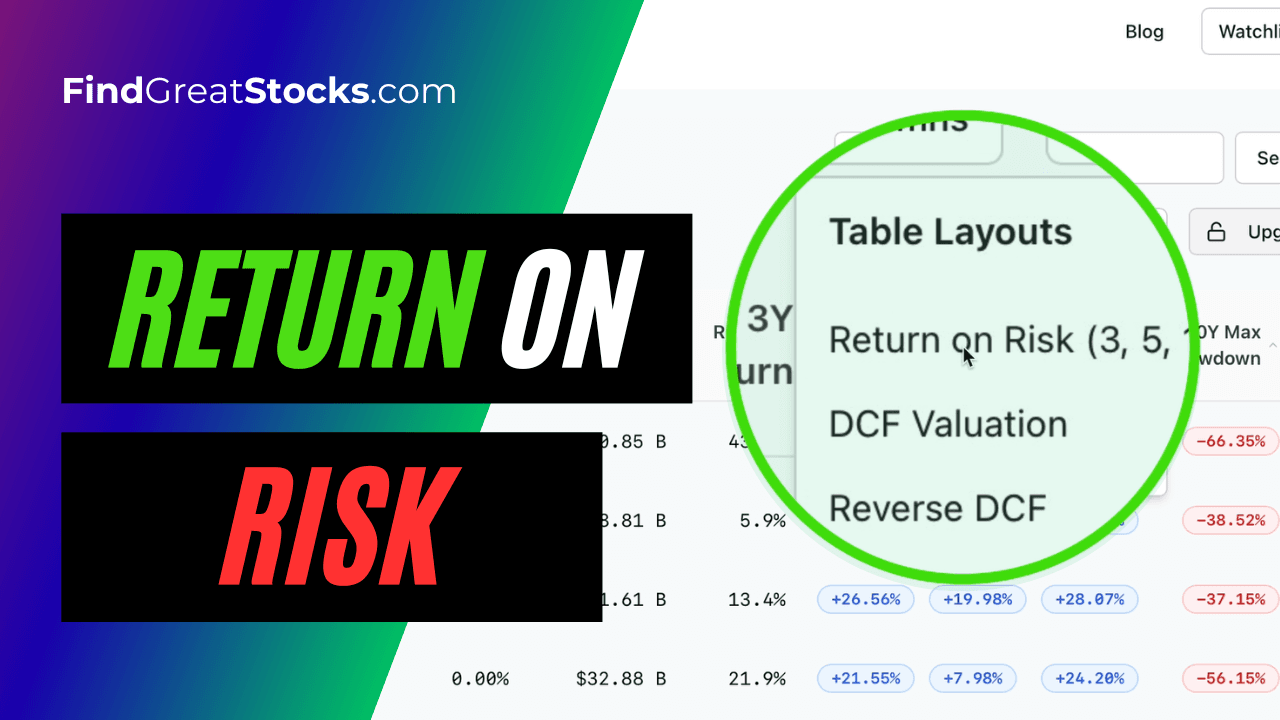
Click the “Choose Layout” section
Select “Reverse DCF”
Rank stocks by DCF Implied Growth to instantly see which companies are undervalued
Why Reverse DCF Matters
Traditional valuation asks, “What’s this stock worth?”
Reverse DCF asks, “What does the market think it’s worth — and is that belief realistic?”
By comparing implied growth to historical performance, you can instantly spot when the market’s expectations diverge from business reality.
This is where value investors find opportunity — and where mispricing creates edge.
Conclusion
The Reverse DCF is not about predicting the future — it’s about understanding what the market has already priced in.
At FindGreatStocks.com, we automate this process so you can quickly see which companies trade below their proven potential and which ones the market might be overestimating.
👉 Visit FindGreatStocks.com and explore which stocks are priced for perfection — and which might still be hidden gems.